By Chip Albright, on November 1, 2023, The NEBB Professional – Q3 2023 Edition
About 20 years ago, The Myth of Face Velocities in Fume Hoods was published. Yet today, little has changed. The misunderstanding about using face velocity to judge containment has actually grown. (Reference The Significance of Laboratory Fume Hood Face Velocities, Caoimhín P. Connell).
Many lab personnel erroneously believe that face velocities are an indication of how well a fume hood works. In other words, many believe that a high face velocity equals containment. It does not.
Face velocities are a useful diagnostic indicator in the event that the hood does not perform well, but face velocity should not be used as the method of determining how well a hood contains. Face velocity is only one component of containment. In the ASHRAE 110 Fume Hood Testing protocol, we perform a face velocity profile. We do a more forensic evaluation of face velocity. This pro- file reflects the level of turbulence across the face of the hood.
But given air is a fluid, it will flow from high pressure areas to low pressure areas. Face velocity just tells us how fast it is flowing.
Let’s examine face velocity more holistically:
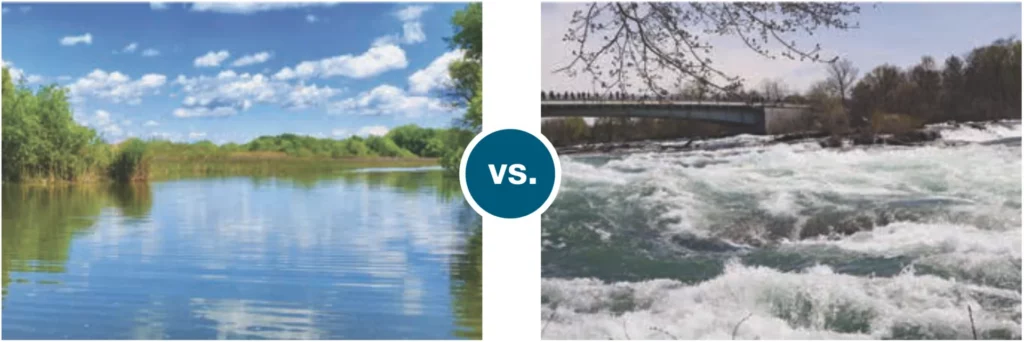
Considering the fact that air is a fluid, it follows the same physical laws (fluid dynamics) as does water. Just like wa- ter in a river, the stream of water can be calm or turbulent. While the water flowing downstream has a speed, it is the combination of speed and turbulence that determines if we have a smooth flowing river or turbulent rapids.
Practitioners testing fume hoods have experienced many of these performance issues first hand. But due to complexity of the overall laboratory ventilation system and the holistic relationship between the fume hood, the room conditions and the user, it is hard to bring the issue of fume hood performance into focus.
The subject of the relationship, or lack of relationship, between face velocity and containment is now coming around again for public discussion. In the June 2022 ASHRAE Journal, a technical article was published on this subject: “Factors Influencing Face Velocity for Fume Hood Containment” by Kang Chen.
“Although there is a growing consensus that face velocity cannot be applied as a sole evaluation indicator of fume hood containment performance…”
How did we get here? Why does such a misunderstanding exist today?
OSHA requires that hood operators take specific measures to ensure that laboratory fume hoods are function- ing properly (§1910.1450(e)(3)(iii)).
What does functioning properly mean? A laboratory fume hood is a hybrid safety device, it is both an engineering control and personal protective equipment (PPE). It falls into the category of an exposure control device. Fume hoods work by capturing the hazards within the fume chamber. Once captured, those hazards are contained within the fume chamber until they are diluted and exhausted. Loss of containment, meaning that the hazards have escaped the fume chamber and have been released back into the laboratory space, is a failure in fume hood performance. Loss of containment is potentially exposing laboratory occupants to hazardous chemicals.
What is face velocity? It is the speed at which air is flow- ing into the hood through the sash opening. What face velocity really tells us is the volume of air flowing into the hood (speed x sash opening). The volume of air has more to do with dilution than containment. The relationship between fume hood face velocity and fume containment is largely misunderstood.
The characteristics of flowing water in a river are very similar to the behavior of air flow in and around a fume hood. Water naturally flows downhill—air naturally moves from a high-pressure area to a low-pressure area. When a hood is performing best, there is a strong pressure difference between the fume chamber and the lab room, and the turbulence in and around the hood is minimal. The more turbulent the airflow in and around the hood, the more likely there will be loss of containment.
Examining a fume hood’s face velocity profile can reveal numerical values that can be an indication of excessive turbulence which can equate to a hood’s loss of containment.
Since we are talking about science, let’s do a little experiment. Measure a single 12” x 12” grid in the sash opening and place two probes (one positioned vertically and one positioned horizontally) within each grid. Connect both probes to our data logger. We will capture a reading from each probe at the rate of one per second for a full 24 hours.
During this time, normal lab activities continue; people walk by, lab doors open and close many times, and other hoods have their sashes opened and closed as people work. After 24 hours of recording, we have 86,400 data points from each probe. Upon analysis, we determine the average velocity is 96 fpm, but we have readings that deviate as much as 40 fpm from the average. Possibly more notable is the fact that the reading is constantly chang- ing. Any single face velocity reading is just a snapshot.
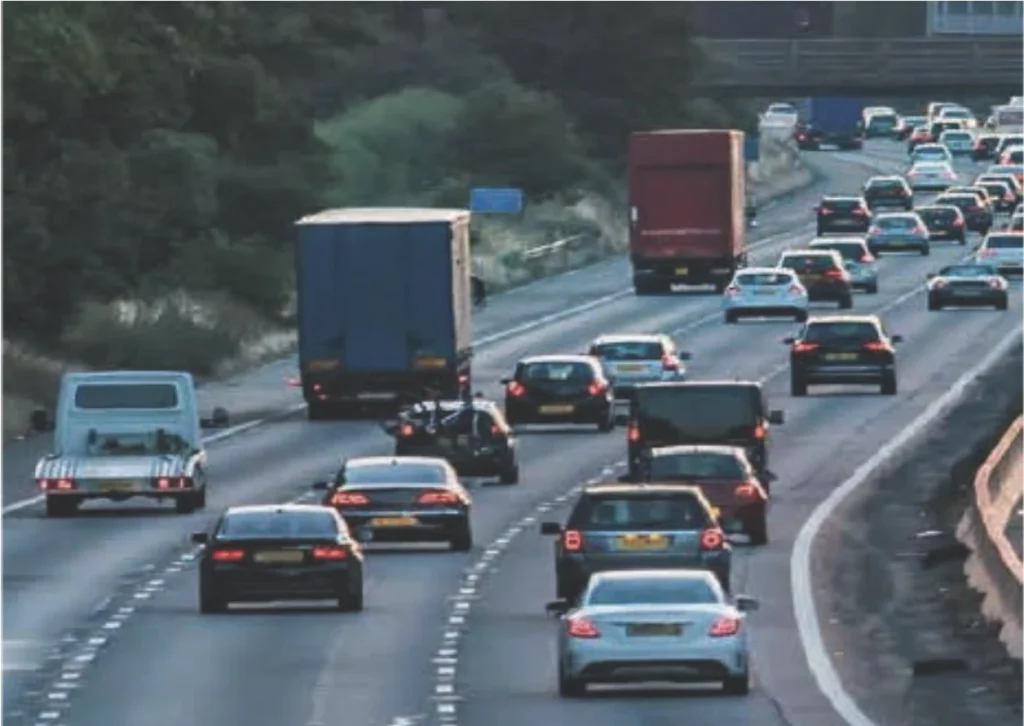
In this photo of an everyday interstate, we cannot determine the speed of the traffic. It is just a snapshot of the speeding vehicles. An average face velocity reading is not much different. Average face velocity readings suggest movement, but otherwise, are mostly useless at determining actual speed. Snapshots of dynamic processes are not good indicators of what is happen- ing over time.
And it only gets more complex. Let’s look at the process of taking a face velocity reading.
If you look closely at the probe in the photo, the sensor is located inside a space that resembles a tunnel, so only air going perpendicular to the opening is measured accurately. You can change the yaw of the probe and the value of the readings change. At a 30% yaw, the ac- curacy can drop by as much as 20%. Thus, air being drawn into the hood from above can hit the probe at an angle and produce turbulence and an eddy, resulting in a less accurate reading. Coupled with the fact that the face velocity is ever changing, it becomes very difficult to get good readings.
In comparison, this photo shows a research grade omnidirectional probe.
This is a typical probe. The hot wire sensor is shielded with a protective shroud to minimize damage.
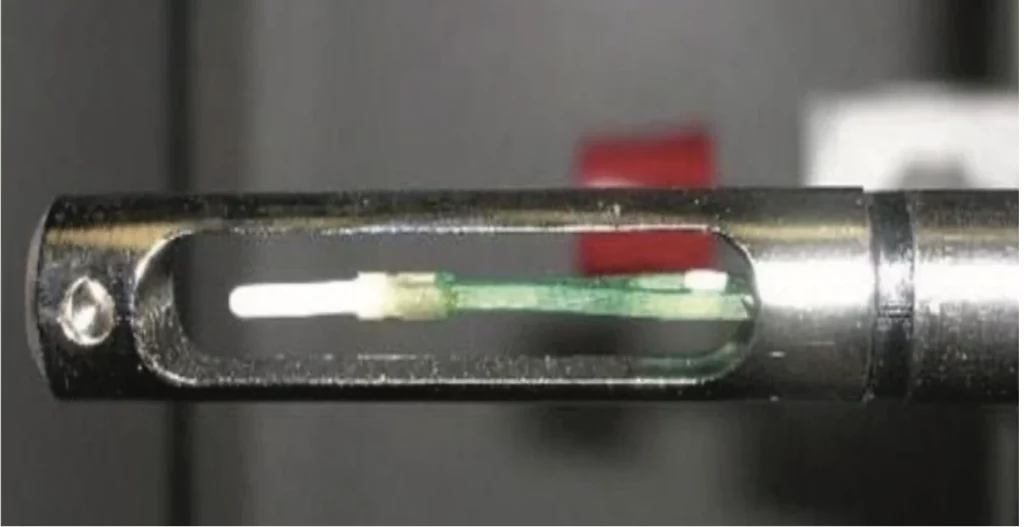
If you look closely at the probe in the photo, the sen- sor is located inside a space that resembles a tunnel, so only air going perpendicular to the opening is measured accurately. You can change the yaw of the probe and the value of the readings change. At a 30% yaw, the ac- curacy can drop by as much as 20%. Thus, air being drawn into the hood from above can hit the probe at an angle and produce turbulence and an eddy, resulting in a less accurate reading. Coupled with the fact that the face velocity is ever changing, it becomes very difficult to get good readings.
In comparison, this photo shows a research grade omnidirectional probe.
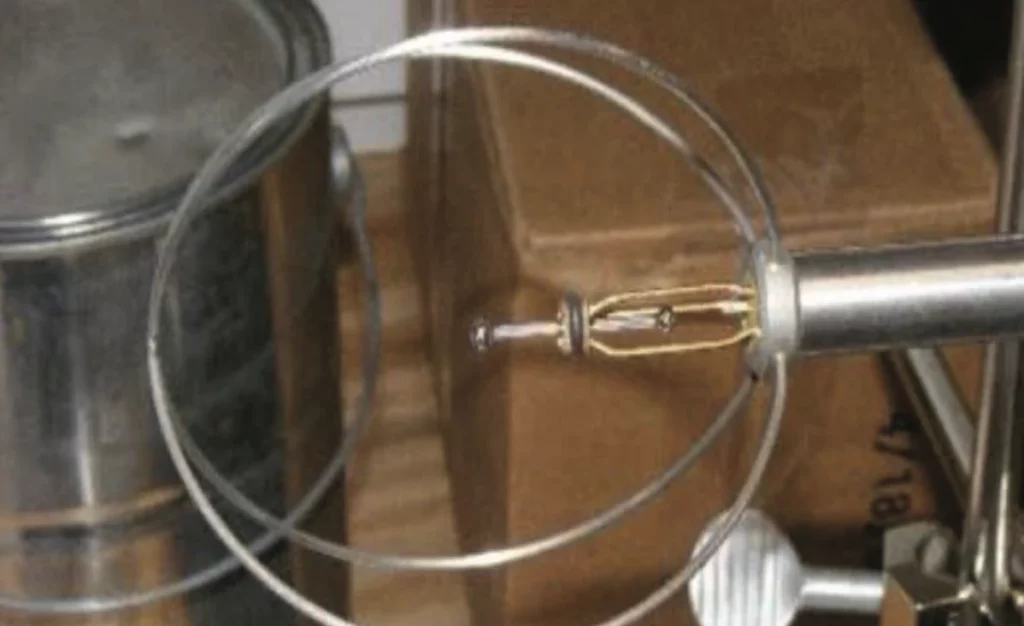
With this probe, we can capture 10 readings per second. We will also reduce the grid size to a maximum of 6 inches square. With these changes, the face veloci- ty profile will look very different. This is similar to the testing protocol developed by the National Institutes of Health (NIH). This profile will better illustrate the turbulence present at the sash opening and will be a good predictor of containment.
Let’s look at a couple of face velocity profiles:
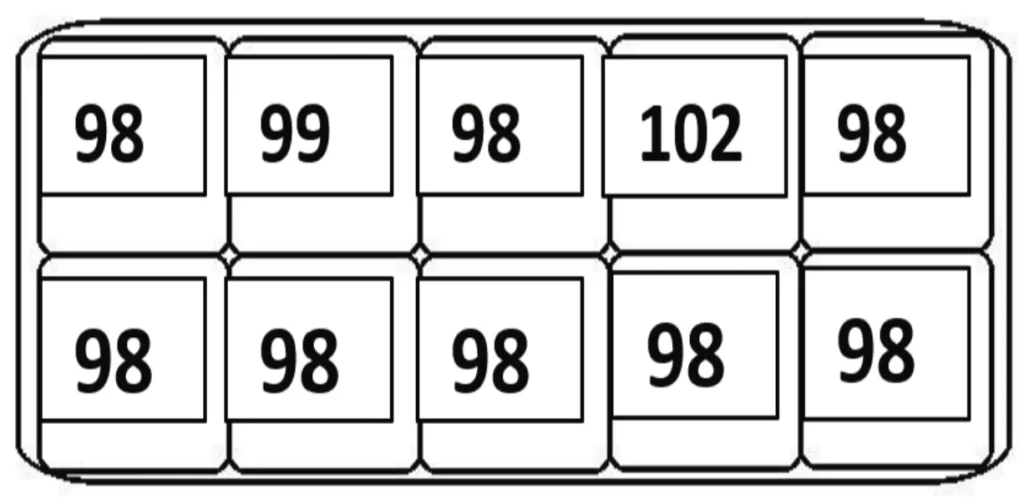
This profile is from a fume hood test room (As Manufactured – AM) with near perfect room conditions. Note the consistency of the velocities
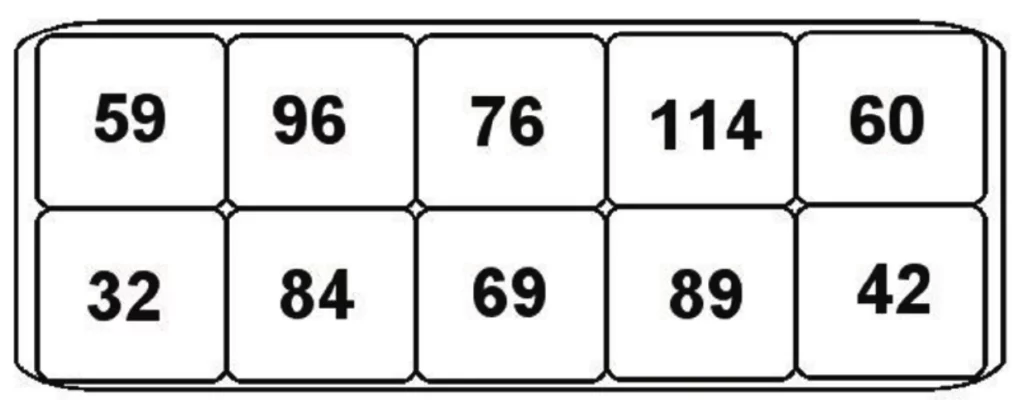
This is the same hood’s profile but tested As Installed (AI). The numbers are nowhere near the same. What can be determined from this AI profile versus the AM profile above?
The hood didn’t change, so the differences in the numbers indicate problems between the hood and the room conditions.
The real question is, “Is the hood performing safely?” From this face velocity profile can you certify the hood is containing? With the data from these profiles, how can you possibly believe that a single point average velocity is telling you anything?
While there are many testers performing the face velocity profile correctly, few really know how to read/interrupt the data in a way that is actionable.
If I were testing this hood and got these numbers, my next conversation would be with the TAB people. The problem is clearly room conditions.
While many people know how to perform the ASHRAE 110 Testing Protocol, few really understand the significance of the data and how to use it to improve performance.
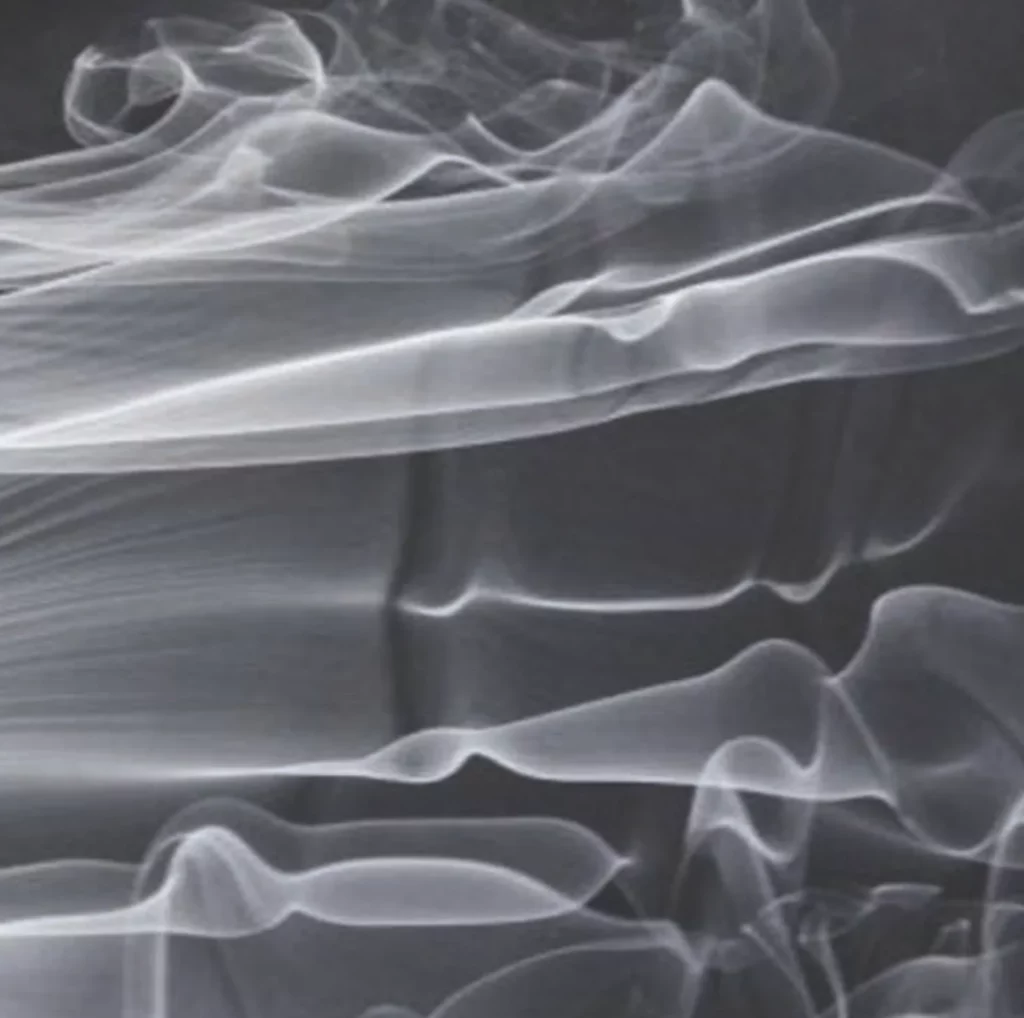
This is often what the airflow inside the hood looks like.
Smoke and Mirrors?
I became involved with Fume Hoods in 1980 working for a major manufacturer. Being naturally curious, I asked a lot of questions and I was often told the subject was too complex for most people to understand. Unfortunately, the nature of manufacturing and selling fume hoods involves a lot of smoke and mirrors—sad but true. Now 40 years later, little has changed.
The real challenge is that fume hood performance is very dynamic. Based on so many variables, the fume hood may well be containing one minute and be los- ing containment another. Room conditions, and other conditions, have a significant impact on fume hood performance.
I once heard a well-known expert at an ASHRAE 110 committee meeting state, “We don’t design hoods to provide robust containment, we design them to perform well on a ASHRAE 110 AM test.”
We can debate the percentage of installed hoods that are functioning safely, but when looking at hoods that fail to safely perform as indicated by an ASHRAE 110 Tracer Gas containment test, over 80% of those had the prescribed face velocity. This quickly debunks the idea that there is a direct relationship between face velocity and containment. Why do these hoods fail a containment test?
-
- 25% of the failures are caused by the design of the actual hood or lab layout issues.
-
- 50% of the failures are caused by room con- ditions. Room conditions are controlled by the laboratory ventilation system which includes not only the hood, but balance of the exhaust and supply air.
-
- 25% are caused by user work practices, which involves the fume hood setup or actions the user takes in or around the hood.
There is some history behind how we got here. In the 1960s and 1970s it was common to install each hood with its own exhaust fan. These hoods had a switch to turn the exhaust fan off and on. Short of being able to hear the fan running, there was no indication of wheth- er the exhaust fan was running or not. Until the OSHA 29 CFR 1910.1450 went into effect, it was common not to see any type of velocity indicating device on a fume hood. But OSHA changed that. After OSHA, (1990s) we began seeing various velocity reading devices add- ed to fume hoods. This is where the concept that face velocity and containment being related really took o Users were told that if the velocity alarm didn’t go into an alarm state, the hood was safe. There was a lot of smoke and mirrors used to sell this philosophy.
In the original article, The Myth of Face Velocities in Fume Hoods, author Caoimhín Connell, claims that the hood velocity alarm is sales trickery. In reality, there are no products or testing procedures on the market that can reliably predict containment in real time. Even ASHRAE 110 is only a snapshot of performance.
If we could see the airflow, managing a fume hood’s performance would be common sense. But because air is invisible, it is very hard to visualize what is really happening in and around a hood.
If not face velocity, what is a good indication of containment? That is the root problem; there has been no easy way to know. Even ASHRAE 110 Tracer Gas testing is just a snapshot. The test has no realistic dynamic challenges that would highlight weaknesses in the hood. Furthermore, SF6 is 6 times heavier than air, which means when released, it quickly falls to the work surface. This characteristic means that we are stress- ing the lower portion of the hood and not the upper portion where the vortex is.
Many people don’t realize that ASHRAE 110 is not a pass/fail standard, but rather a testing protocol. The 110 standard suggests that the testing procedures should be modified to fit the specific requirements of the lab. Many people refer to the ANSI Z9.5 (Laboratory Ventilation) standard for guidance for what is a pass/ fail when using ASHRAE 110.