By Stuart McGregor, The NEBB Professional – Q2 2024 Edition
It’s not uncommon for members of the Sound and Vibration (S&V) Committee to field questions from NEBB S&V Firms and Certified Professionals (CPs) regarding sound data, vibration data, and instrumentation. Such questions have involved three recurring themes, which we aim to shed light on as a means of helping others avoid the same potential mistakes, useless data, and repeat work:
- The proper instrumentation setting to take sound data to generate Noise Criteria/Room Criteria curves.
- Instrumentation set-up for vibration measurements, so usable data can be taken.
- The issue of Sound level meter calibration requirements.
Those who have taken the Sound CP or Sound CT courses know that the instructors stress the proper setting on a sound level meter when taking sound data to generate Noise Criteria (NC) and Room Criteria (RC) curves/ratings. Remember, most sound specifications call for one or two measurements: the overall sound levels which is typically a dBA measurement, and/or the NC/RC rating which is an octave band measurement. The octave band measurement for NC/ RC must always have the instrument set to the frequency weighting of unweighted or dBZ.
In accordance with the 2015 NEBB Sound and Vibration Procedural Standard, a sound level meter/ analyzer should be set up as follows:
- Frequency Weighting – Z, Linear, Flat (this designation is different for different instruments)
- Time Constant – Slow
- Averaging – time average over 60-seconds
- Full Octave data – from 31.5 to 8,000 Hz
The labeling for the unweighted setting may vary from manufacturer to manufacturer, and may be dBZ, dB(- Flat), or dB(Linear). Read the owner’s manual of your instrument. This doesn’t seem too hard, however, it brings up a nuance depending on the manufacturer of the sound level meter, or SLM. Let’s look at two examples:
- Manufacturer A has set-up options which apply the frequency weighting (dBA, dBC or dBZ) to both the overall sound level and the octave band sound levels.
- Manufacturer B has set-up options which allow the user to set the overall sound level frequency weighting (dBA, dBC, or dBZ) and then independently set the octave or third octave band frequency weighting (dBA, dBC, or dBZ).
The error arises when both overall sound levels and octave band data are to be measured. If the instrument is not configured correctly, then the A-weighting may be applied to the octave band sound level readings. So, what does this error really mean when the octave band data is measured A-weighted instead of un-weighted? The examples in the following figures will illustrate.
Figure 1: Equipment On Levels are Less than Background Levels
Figure 1 shows three sound level spectra plotted on a Room Criteria (RC) chart; the first is an un-weighted sound spectrum, the second is the A-weighting applied to this sound spectrum, and the third is the un-weighted background sound levels.
Inspection of Figure 1 shows the following:
- The unweighted sound spectra in an RC-30(R). R is the quality factor for rumble.
- The A-weighted sound spectra is below the background sound levels in the 31.5 and 63 Hz octave bands and 2 dB above the background in the 125 Hz octave band.
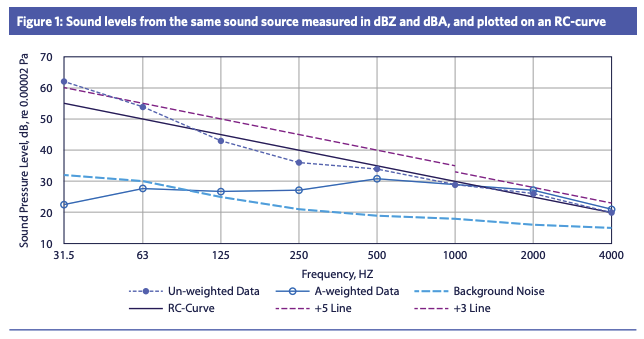
So, what does this mean? In the NEBB Sound CP course, candidates learn that when a measured sound source level is within 10 dB of the background sound levels, that a correction for background sound levels must be done before the Noise Criteria (NC) or Room Criteria (RC) plots are made. In this case, one can make a correction for the 125, 250, 2000, and 4000 Hz octave bands; although, the correction in the 125 Hz octave band is sketchy since it is so close to the background.
The question is, what can be done with the 31.5 and 63 Hz octave bands? Well, nothing. Since the A-weighted data is below the background levels, there is no method to make a correction. The data is just not usable, and the measurements will need to be repeated. This is analogous to jumping into a swimming pool. If the water is clear, you can see where to jump to miss the obstacle under the water’s surface; however, if the water is muddy, you do not know where to jump.
The point to take home is that one must set the sound level meter/analyzer up correctly for the measurement that needs to be made. This is especially important because you may not be able to recover the test data, which would lead to retaking measurements, increased cost, and lower profit.
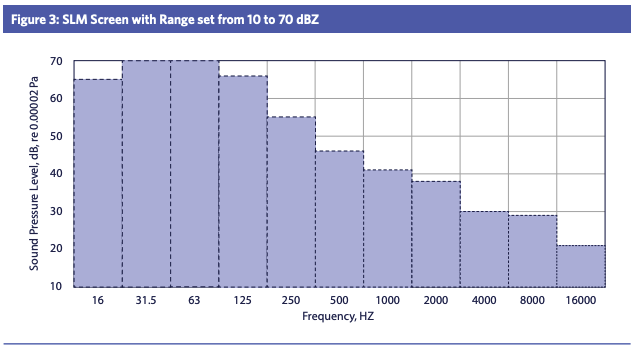
Figures 2 – 3: Range Setting on Real Time Analyzer SLM Display Not Set Correctly
The intent of Figures 2 and 3 is to resemble the sound level meter display.
Figure 2 shows measured sound levels with the Real Time Analyzer (RTA) display range set so that none of the octave band sound levels exceed the upper display range limit of 80 dBZ.
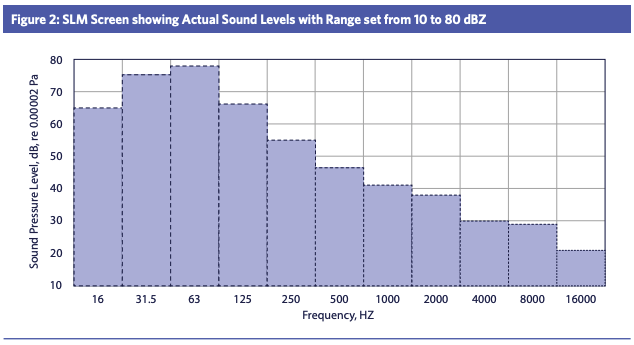
Figure 3 shows the same data, with the exception of the RTA display range set to 70 dBZ. Note, if all we see is Figure 3, we do not know what the sound levels are in the 31.5 and 63 Hz octave bands.
With RTA SLMs, the measured sound data is stored in a data file on the RTA and can then be downloaded for plotting and report preparation. Let’s consider the implications of this for the examples in Figures 2 and 3.
Depending on the RTA you own, if you had the display range set as shown in Figure 3 with an upper display limit of 70 dBZ, the RTA may truncate the data at 70 dBZ. Then, you would not know that the actual sound levels in the 31.5 and 63 Hz octave bands are 75 and 78 dBZ, respectively. That means when plotting an NC or RC chart, your measurement results will show lower ratings than actual.
Some RTAs will log and store the correct sound levels regardless of the meter display limits, and some will truncate data at the display limits.
The takeaway here is twofold.
First, understand exactly how your meter logs and stores measured data. Is the display only a human interface and does the meter log and store actual data, or does your meter truncate data based on the upper and lower display limits that you see on the meter?
Second, it is simply good measurement practice to sample the sound levels in the area you are measuring data and adjust the meter display range so that upper sound levels for ALL the octave band display bars are visible and displayed sound levels are below the upper display range limit.
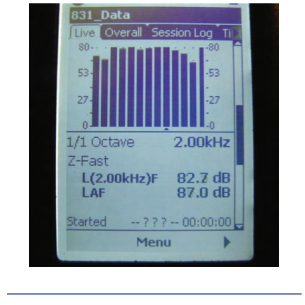
Finally, Figure 4 shows a photograph of a real time analyzer display ranged correctly and showing all octave band bars below upper display range. However, Figure 5 shows a photograph of a real time analyzer display NOT ranged correctly, showing some octave band bars at or above the upper display range.
Figure 4: Photograph of Real Time Analyzer Display Ranged Correctly, Showing All Octave Band Bars below Upper Display Range
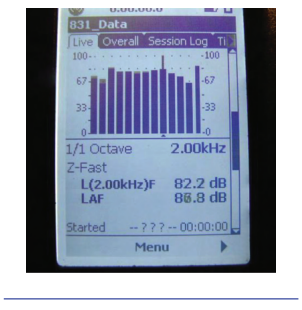
Figure 5: Photograph of Real Time Analyzer Display NOT Ranged Correctly, Showing Some Octave Band Bars at or above the Upper Display Range
For those interested in deepening their understanding of Sound Measurement, NEBB offers the Sound Home Study Course, which provides a comprehensive exploration of this field. Additionally, our NEBB Online Learning Center features a concise course on the Review of Logarithms, ideal for those seeking to strengthen their foundational knowledge. The Sound and Vibration Committee organizes annual seminars on Sound and Vibration Measurement with written and practical certification testing offered at the seminar. Discover these educational opportunities and more at nebb.org.
**Written by NEBB S&V Committee member Stuart McGregor, this article has been peer reviewed by NEBB S&V Committee members Chad Matthews (acting committee chair), Elizabeth Blankenship, and Joseph Reynolds.